
Message Deliverability
[ˈmɛsɪdʒ dɪˌlɪvərəˈbɪlɪti]Message deliverability measures the percentage of SMS messages that successfully reach recipients’ mobile devices out of the total messages sent by a business or organization.
Why Message Deliverability Matters
Message deliverability represents the fundamental metric determining whether your SMS communication strategy succeeds or fails. Unlike email where messages might land in spam folders, undelivered text messages simply disappear, creating a communication void that directly impacts business operations and customer relationships.
The business implications of poor deliverability extend far beyond wasted messaging costs. When a two-factor authentication code fails to arrive, customers abandon purchases. Missed appointment reminders lead to no-shows costing healthcare providers an average of $200 per incident. Failed delivery notifications result in customer service calls that cost 50-100 times more than the original SMS. For time-sensitive communications, even 95% deliverability means 1 in 20 critical messages fail.
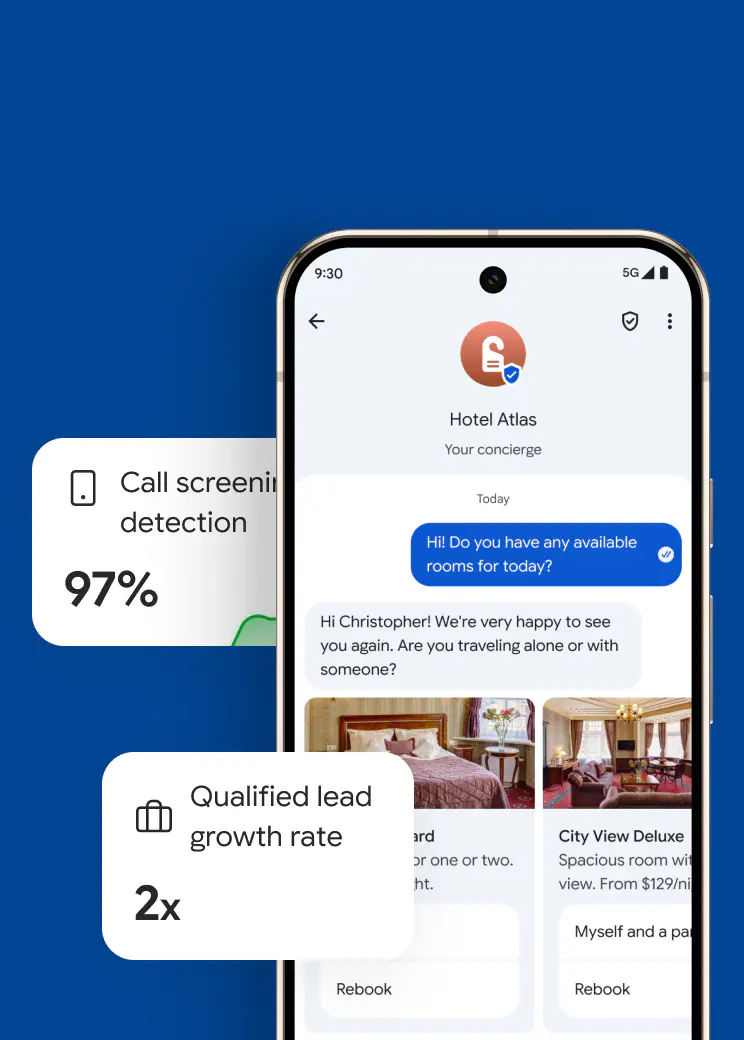
Modern consumers expect instant, reliable SMS communication. Studies show 90% of text messages are read within three minutes of delivery - but only if they arrive. As businesses increasingly rely on SMS for critical workflows, deliverability becomes a competitive differentiator. Companies achieving 97%+ deliverability see higher customer satisfaction, reduced operational costs, and improved conversion rates compared to those accepting industry-average 85-90% delivery rates.
How Message Deliverability Works
Message deliverability involves a complex journey from sender to recipient, with multiple potential failure points along the transmission path. Understanding this journey helps identify optimization opportunities.
The SMS Delivery Path:
When you send an SMS, it first reaches your messaging provider’s platform, which validates the format and recipient number. The provider then routes the message to the appropriate carrier network based on number portability databases and routing tables. Each carrier processes the message through spam filters, checking sender reputation and content compliance.
Key Stages and Potential Failures:
Submission Stage: Your system sends to the SMS gateway
- Failures: API errors, authentication issues, malformed requests
Gateway Processing: Message validation and routing determination
- Failures: Invalid numbers, blocked senders, credit limits
Carrier Acceptance: Network receives and evaluates the message
- Failures: Filtering, reputation blocks, compliance violations
Network Routing: Message travels through interconnected systems
- Failures: Network congestion, routing errors, international blocks
Device Delivery: Final transmission to recipient’s phone
- Failures: Device offline, storage full, number deactivated
Measurement and Reporting:
Delivery receipts (DLRs) provide status updates at various stages, though not all carriers support detailed reporting. “Delivered” status typically means carrier acceptance, not necessarily device receipt. True end-to-end confirmation requires advanced delivery receipt handling and sometimes application-layer acknowledgments.
Network conditions, carrier relationships, and technical configurations all influence deliverability. Peak traffic periods can reduce rates by 5-10%, while poor peering agreements between carriers might cause systematic failures to specific networks.
Best Practices with Message Deliverability
Implement comprehensive number validation - Verify numbers at collection using HLR (Home Location Register) lookups to identify invalid, deactivated, or landline numbers before sending. This prevents unnecessary failures and protects sender reputation.
Optimize message content and format - Keep messages concise, under 160 characters when possible. Avoid spam triggers like ALL CAPS, excessive punctuation, or URL shorteners. Use proper UTF-8 encoding for special characters to prevent fragmentation issues.
Configure intelligent retry logic - Implement exponential backoff for temporary failures: retry after 1, 5, and 15 minutes. Set maximum retry attempts based on message priority. Never retry permanent failures like invalid numbers.
Monitor deliverability by segment - Track rates separately by carrier, geographic region, message type, and time sent. This granular view reveals specific problem areas. A 95% overall rate might hide 80% delivery to rural T-Mobile customers.
Maintain multiple routing options - Configure primary and backup routes through different aggregators or direct carrier connections. Automatic failover prevents single points of failure during carrier outages or maintenance windows.
Build feedback loops - Create mechanisms for recipients to report non-delivery through your app or website. This catches silent failures and provides data for troubleshooting systematic issues carriers might not report.
Schedule around optimal windows - Analyze your delivery data to identify peak performance times. Avoid carrier maintenance windows and network congestion periods. For global sending, consider recipient timezone and local carrier patterns.
Real world examples
- Ecommerce

Improved cart recovery by 34% after optimizing deliverability to 97.5%
Read more - Customer Service

Reduced support tickets by 23% through better notification delivery rates
Read more
Common misconceptions
Sent only means submitted to carriers; delivered confirms receipt on the recipient's device successfully.
Even perfect senders see 95-98% rates due to device issues, network problems, and carrier policies.
Many failures occur silently without error messages, especially when filtered by carriers for spam.
International routes face additional complexity with 70-85% typical delivery versus 95%+ domestic rates.
Related terms
In this article:
Ready to use your business number for text messaging?
Thousands of businesses are already experiencing the power of conversational messaging through SMS. Join us. Free trial and paid tiers available.
Get StartedFAQ
Have questions? We've got answers.
Find what you need quickly and clearly with our most frequently asked questions.
Delivery rate measures successfully delivered messages against total sent, while deliverability rate accounts for messages that could potentially be delivered if all factors were optimal. For example, if you send 1,000 messages with 950 delivered, that's a 95% delivery rate. But if 30 recipients had invalid numbers, your true deliverability rate is 950/970 = 97.9%, showing your performance among reachable recipients.
Track multiple metrics beyond basic delivery rates: monitor by carrier, time of day, message type, and geographic region. Set up real-time alerting for rates below 95%. Use delivery receipts (DLR) to confirm carrier acceptance versus device delivery. Implement feedback loops with customers to catch silent failures. A/B test message content and sending times. Most importantly, establish baseline metrics before making changes to measure impact accurately.
Technical failures include incorrect number formatting, expired or ported numbers, network congestion during peak hours, routing path failures, and carrier interconnection issues. Device-level problems involve full message storage, devices turned off, or network coverage gaps. Protocol mismatches between SMPP versions, character encoding errors with special symbols, and message segmentation problems for long texts also impact delivery. Improper API integration causing malformed requests drops messages before they enter carrier networks.
Budget considerations include monitoring tools ($200-2,000/month), number registration and compliance ($500-5,000 setup), premium routing for critical messages (2-3x standard rates), and list hygiene services ($0.01-0.03 per verification). Factor in opportunity costs - a 5% improvement in deliverability for 100,000 monthly messages saves $50-150 in messaging costs while potentially recovering thousands in lost revenue from failed notifications.
Transactional messages (passwords, confirmations) achieve 95-98% delivery with proper setup. Promotional messages typically see 85-92% due to stricter filtering. Conversational messages with established relationships deliver at 93-96%. Time-sensitive alerts perform best when sent during business hours. International messages vary widely by country, from 70% in some regions to 95% in others. Message length also matters - single segment messages deliver 3-5% better than multi-part messages.
Timing significantly impacts delivery success. Messages sent during carrier maintenance windows (typically 2-4 AM) face higher failure rates. Peak hours (9-10 AM, 12-1 PM, 5-6 PM) experience network congestion reducing delivery speeds. Weekend delivery can drop 5-10% due to different carrier policies. International messages must consider timezone differences and local carrier patterns. Spreading high-volume sends across hours prevents triggering velocity filters while improving overall deliverability.